Senior Performance Management

Analysis of key business indicators,
one click away

Get complete control over your business and predict the impact of business
decisions with performance management reports

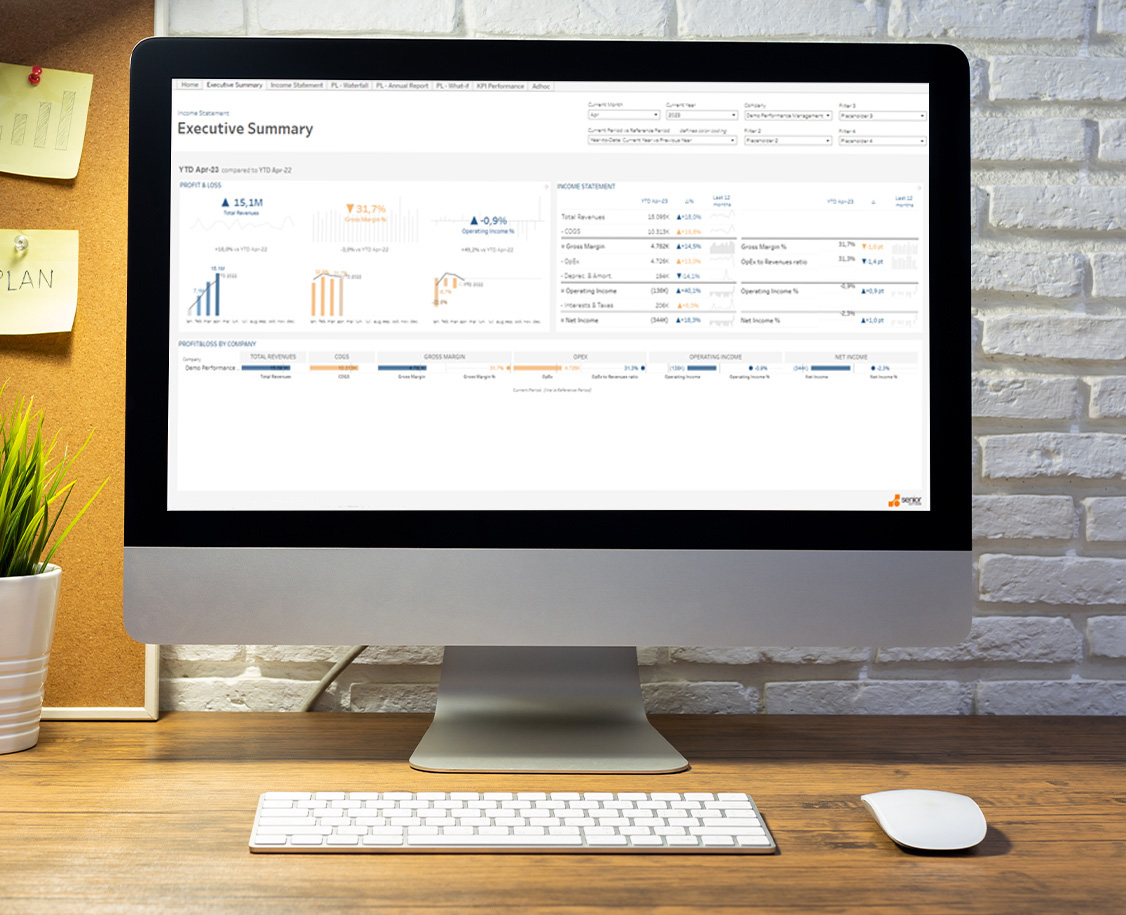
Performance analysis software for modern companies

Senior Performance Management collects and consolidates company data, into a unique database, which represents a foundation for the entire process of business performance management.

By analyzing disparate data for analysis and forecasting, the system helps you efficiently manage the company’s financial and operational performance, offering data validation and auditing, together with integrated workflows and increased security.

Benefits gained with
Senior Performance Software:

Acces rapid, din orice browser, la informatii cheie cu privire la activitatile companiei

Identificarea rapida de solutii cu rapoarte obtinute in timp real

Making the best business decisions by using simulations and what-if analyses

Increased control and complete visibility over income and expenses

Lowering the time dedicated to making reports & business analyses

Optimizing workflows by efficiently organizing data at company level

Senior Performance Management Software – Smart predefined Dashboards

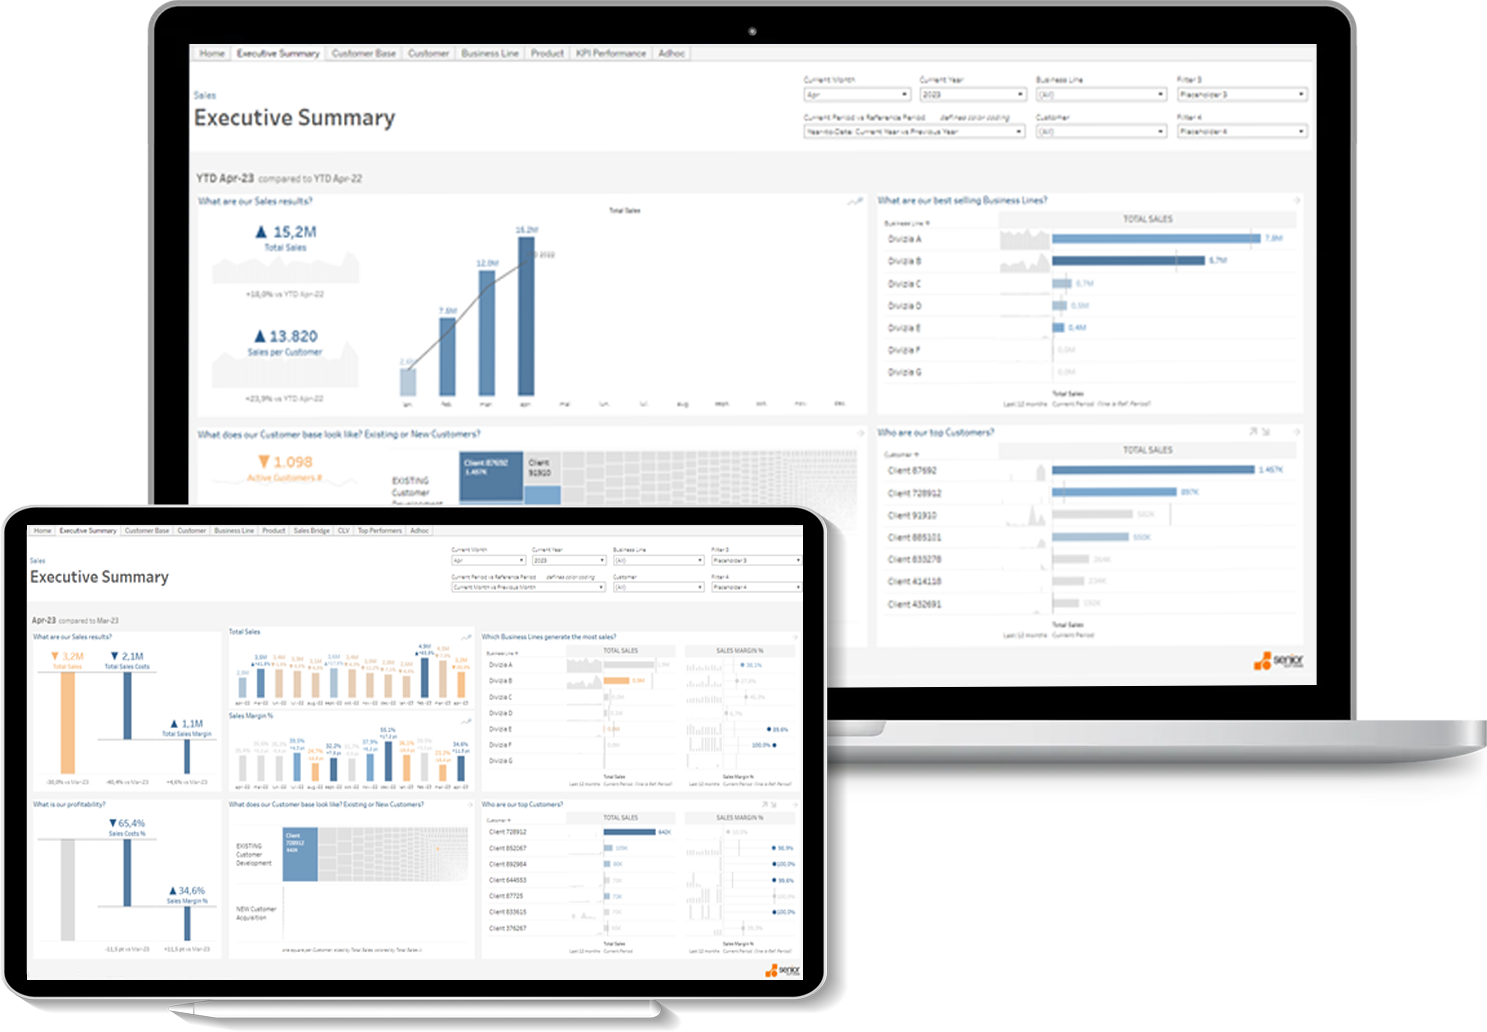
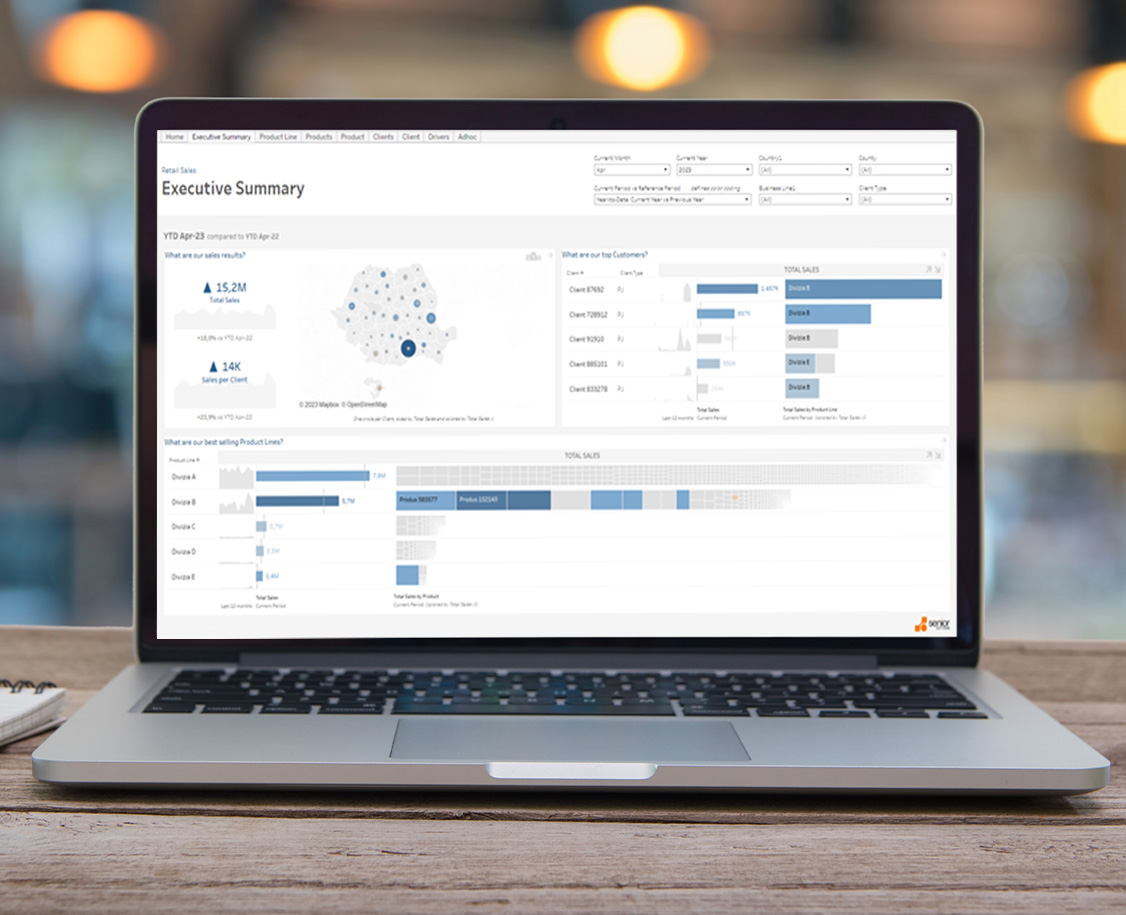
Find out how you can sell more

The sales analysis dashboard guarantees greater visibility over the main factors on which the sales process is based, and among the benefits it offers to company we count:

Detailed segmentation of customers based on their needs and preferences, to produce accurate profiles of purchasing behavior

Predictive sales analysis, to identify areas where sales growth is easier to achieve and to effectively focus the efforts of the sales force

Increasing the conversion rate from lead to deal, with the help of the pipeline analysis and inspection tool

Optimal monitoring of sales parameters, through sales analysis tools and analytical functions

Get transparency in profitability analysis

The profitability analysis dashboard facilitates, in real time, complete transparency on each business activity’s profitability, and, among the benefits it offers to companies, there are:

Full transparency of profitability measures

Multidimensional perspective of profitability

Efficient allocation of all variable direct costs

Identifying the factors that really determine operational profitability

Efficient allocation of capital

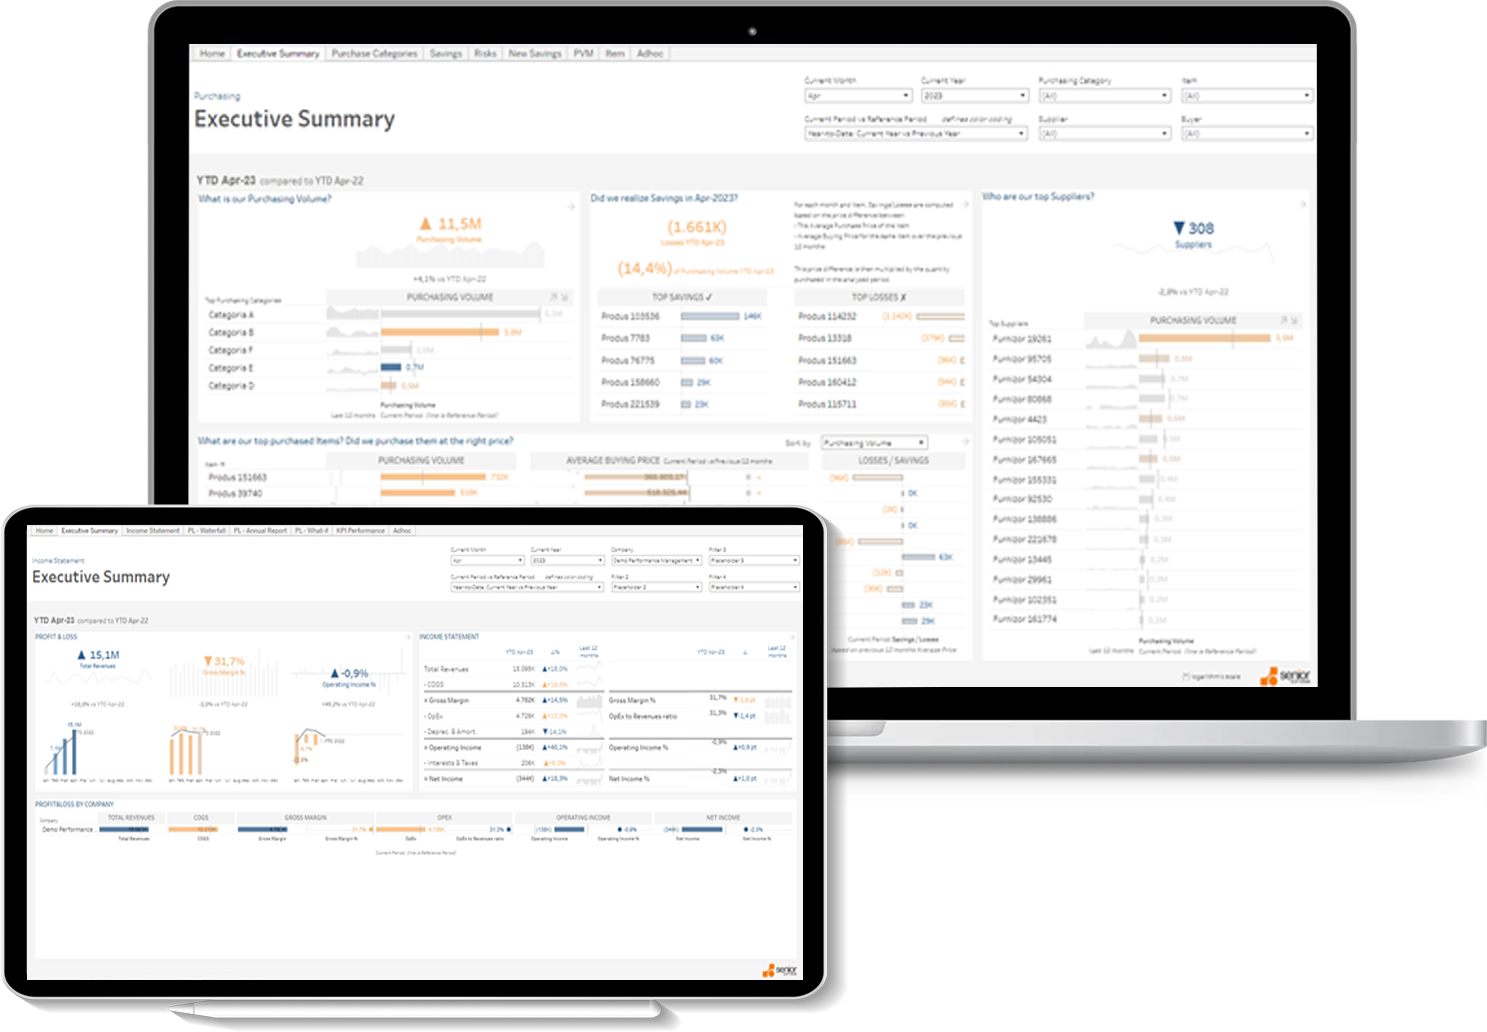
Gain a better understanding of costs

The expenditure analysis dashboard helps you identify which categories of expenses generate the highest purchase value and which are the suppliers with the highest cost. Among the benefits it gives companies are:

Effective evaluation and monitoring of the volume of expenses

Better understanding of expenditure allocation by category

Correct allocation of expenses based on suppliers

Detailed analysis of expenses at supplier and expense category levels

Performance analysis based on supplier or expense category with the possibility of filtering on active suppliers, new suppliers or total suppliers

spm pentru managementul performantei - dashboarduri pentru vanzari si profitabilitate 2023

Thanks to the partnership with Senior Software, we managed to quickly extract data of interest and have increased visibility of the business and of the business direction that we must follow. Currently, we access detailed reports, easily track performance indicators and can easily analyze departmental efficiency.”

Alin Ionescu, Executive Manager – Pro Activ

Evaluate and monitor consolidated financial statements

The financial dashboard is a smart tool that allows financial and accounting teams to visualize, monitor and report financial performance indicators. The key functions of the financial analysis tool are:

The profit and loss account (Profit & Loss) – is a tool with an essential role in the decision-making process because it highlights the aspects that generate profit or loss, it allows the evaluation of the business and provides data on the ability to generate value and, at the same time, contribute to the efficient management of expenses. Moreover, it helps you identify if the product or service offered is profitable or not and gives you a clearer understanding of the correct decisions to maximize profit or reduce losses.

General balance sheet – the dashboard allows you to review and analyze the data from the balance sheets, to gain a quick understanding of the financial situation of the business, as well as to discover any anomalies in data. By providing a summary of financial balances (asset and liability accounts), this report evaluates the financial position of the company at a certain date.

Controls and optimizes purchasing activities

The purchase control and optimization dashboard helps determine the areas where you can save and minimize risks, and among the benefits it offers to companies are:

Identifying dependence on a single supplier and avoiding the risk of delays or supply interruptions

Monitoring and comparing purchasing prices, with detailing at item level, to determine the minimum and maximum purchase prices, thus avoiding excessive fluctuations

The possibility to track volume and savings or losses from purchases by categories and products, by evaluating the difference between current purchase price and the estimated average purchase price during the last 12 months

Managing the volume of purchases and determining the areas where savings can be obtained from purchases

Quick identification of the most purchased products, as well as if they were bought at the right price

Effectively follows up on customer receivables

The billing dashboard contributes to better cash flow management, which is a priority for the business, regardless of the size of the business, and among the benefits it offers to companies are:

Quick collection of relevant data displaying of information in real time, in a single screen

Automating and simplifying of the debt recovery workflow

Centralized management of financial information and access to accurate data

Effective evaluation of the degree of customer receivables collections, in order to identify solutions to reduce the balance of unpaid invoices

Easily manage balances owed to suppliers

The dashboard intended for bills to be paid to suppliers ensures a clear picture of expenses in relation to income. Among the benefits it offers to companies are:

Clear picture of expenses in relation to income

Automating and simplifying workflows related to the payment of debts

Centralized management of financial information and access to accurate data

Efficient monitoring of invoice payment levels and easy planning of payments to suppliers

spm pentru managementul performantei - dashboarduri analiza financiara achizitii 2023

The system helps us through the reports we can issue regarding clients, partners, products, sales. We can perform quick analyses regarding the fluctuation of costs, sales to certain customers and regarding the evolution of products according to any criteria of interest. Also, the solution for analysis and forecasting helps us in everything that means mid and long-term estimates, increases at partner level and not only, including in the purchasing area and, especially, on the sales side.”

Lucian Gradinaru, Executive Manager – UrsPack

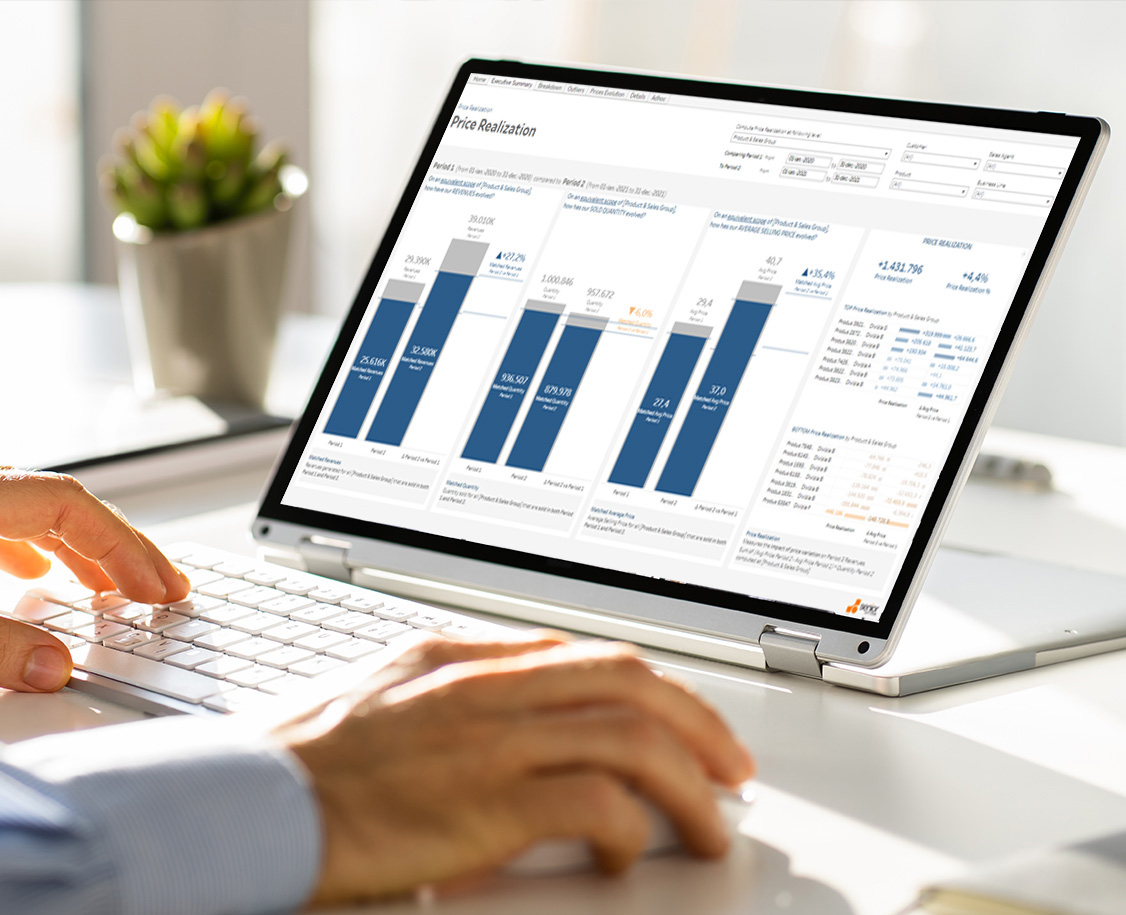
Analyzes sales prices variations

The price realization analysis dashboard contributes to the evaluation of the performance of the products that were sold in a certain period of time. Among the benefits it offers to companies are:

The correct assessment of the variation in the average selling price of a product and its impact on revenue

Thesales performance dashboard helps with evaluating and making accurate forecasts regarding the evolution of sales, and among the benefits it offers to companies are:

Timely identification of out of the ordinary values

Complete auditing of price evolution for each individual product

Detailed analysis of quantitative sales, value or average prices at the level of: product, customer, agent, sales group, city, country, over a set historical period (Ex.: the last 5 years, the last 12 months, last 2 quarters, etc.)

managementul-performantei-Gestioneaza-usor-soldurile-datorate-catre-furnizori-cu-dashboard-Accounts-Payable-2
Increases sales performance

The sales performance dashboard helps evaluate and make correct forecasts regarding the evolution of sales, and among the benefits it offers to companies are:

Easy monitoring of sales results, through the interactive map, by counties and cities

Easily establish the level of contribution of products or stores in increasing / decreasing sales by product line, business line or division, by analyzing sales drivers

Quick access to detailed information on value sales

The possibility of making strategic decisions, by creating a detailed analysis of products at the level of: product line, customer, store, type of store, city, county, country

managementul-performantei-senior-spm-Creste-performanta-in-vanzari-cu-Retail-Sales-dashboard-2
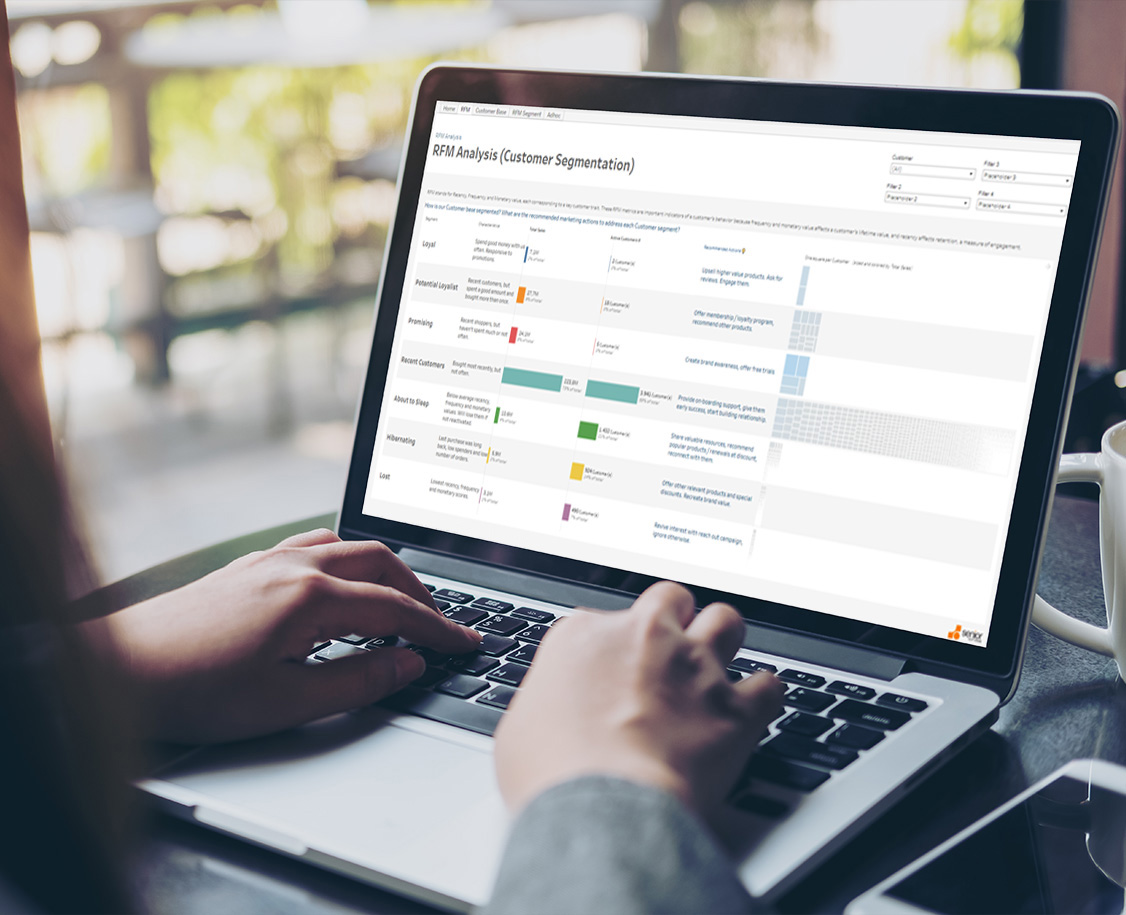
Improve business performance through RFM analysis

RFM (Recency, Frequency, Monetary Value) analysis is a powerful technique that helps companies segment customers according to their buying behavior and measures how recently, how often and how much each of the company’s customer has bought. By applying the RFM analysis, the most valuable customers can be identified, marketing campaigns can be adapted to different segments and customer retention can be improved.

The RFM analysis dashboard is a valuable tool for business, and among the benefits it offers companies are:

Improving the customer segmentation and targeting process

Obtaining a better understanding of buying behavior

Easy identification of top customers

Real-time visibility on high-risk customers

Increasing customer retention

managementul-performantei-senior-spm-dashboard-RFM-analysis-2
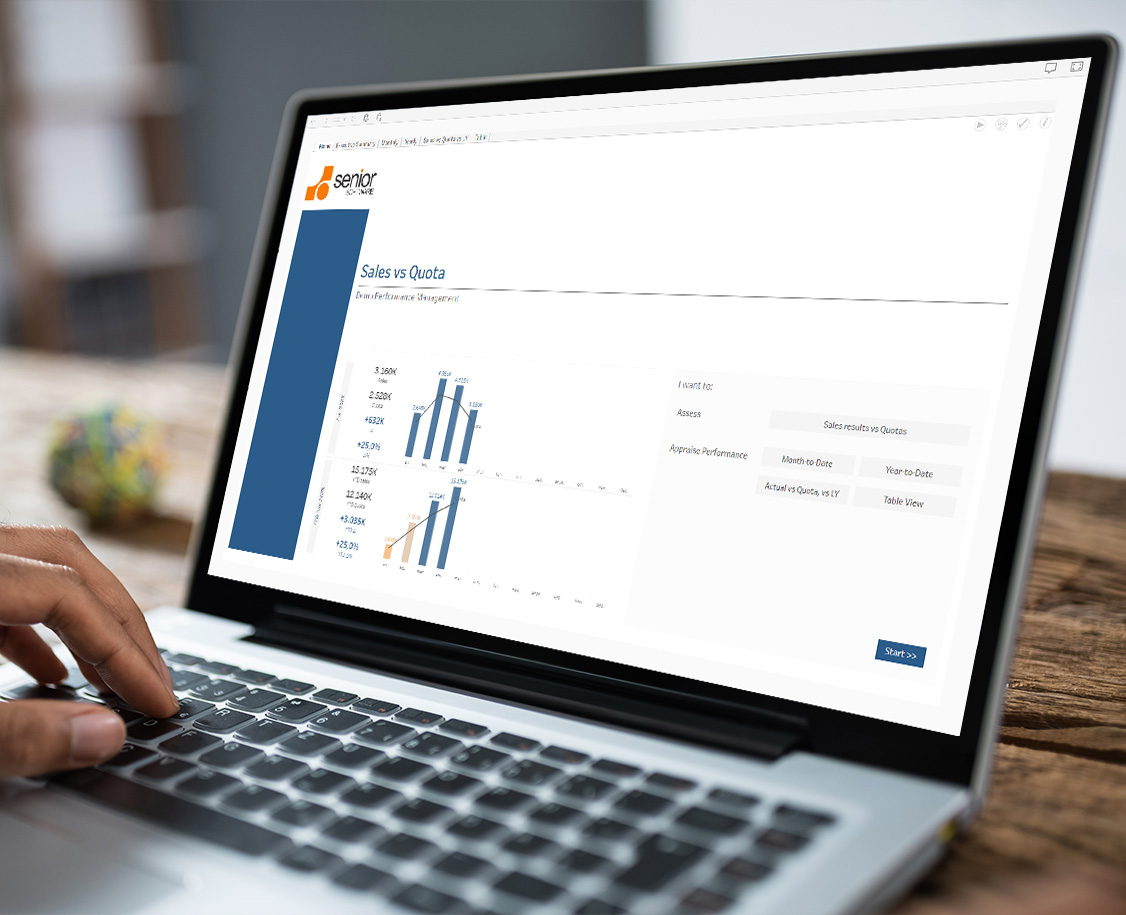
Create a successful sales strategy

The sales analysis vs. quota dashboard helps diagnose the challenges faced by certain regions and assists managers during sales cycles, and among the benefits it offers companies are:

Quick access to information regarding profitability analysis by cost centers

Detailed analyses regarding the achievement of objectives, from different perspectives MTD (Month To Date), YTD (Year To Date), Actual vs Target vs LY (Last Year)

Easy management and setting of sales goals

Improving sales performance

Overview of sales activities and recorded progress

Creeaza-o-strategie-de-vanzari-de-succes-cu-senior-SPM-pentru-management-performanta-2
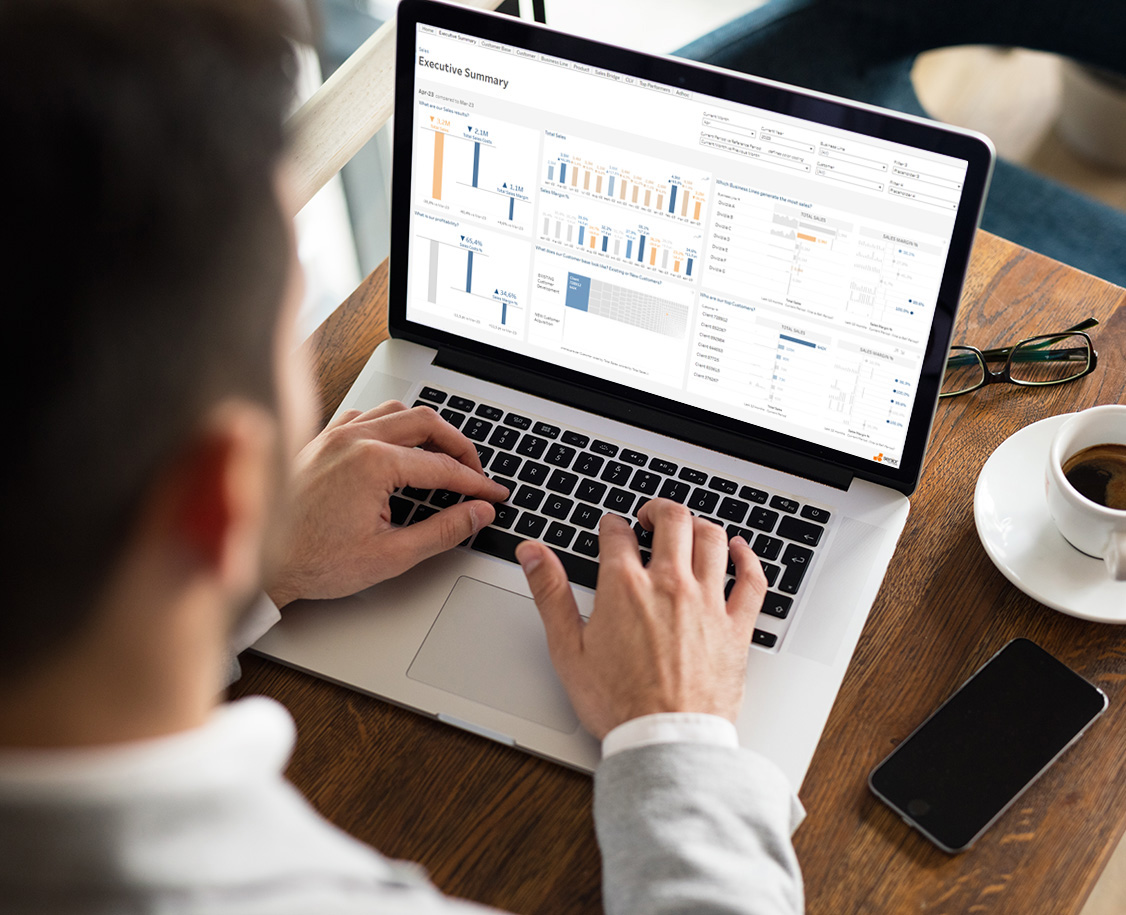
Analyze profitability from different perspectives

The analysis and profitability dashboard provides information about the potential results and risks of different scenarios, allowing you to make better business decisions.

Through the dashboard, you have the opportunity to monitor and control sales performance, while also having the ability to take corrective measures, if necessary, by comparing actual results with the target profit and identifying sources of variation.

The performance management application gives you access to critical information, through which you can analyze the company’s profitability from different perspectives, such as: Current Month Actual vs. Target or YTD (Year To Date) Actual vs. Target.

managementul-performantei-senior-spm-dashboard-profitabilitate-2
Updates the budget according to the trends in the profit and loss account

The system for analysis and reporting helps us a lot in the correct evaluation of relations with suppliers, in making sales reports – which are customized by agents, by region, by producers, by several criteria at the same time and are much easier to use.”

Andrei Vernica, Shareholder – Vet Diagnostic

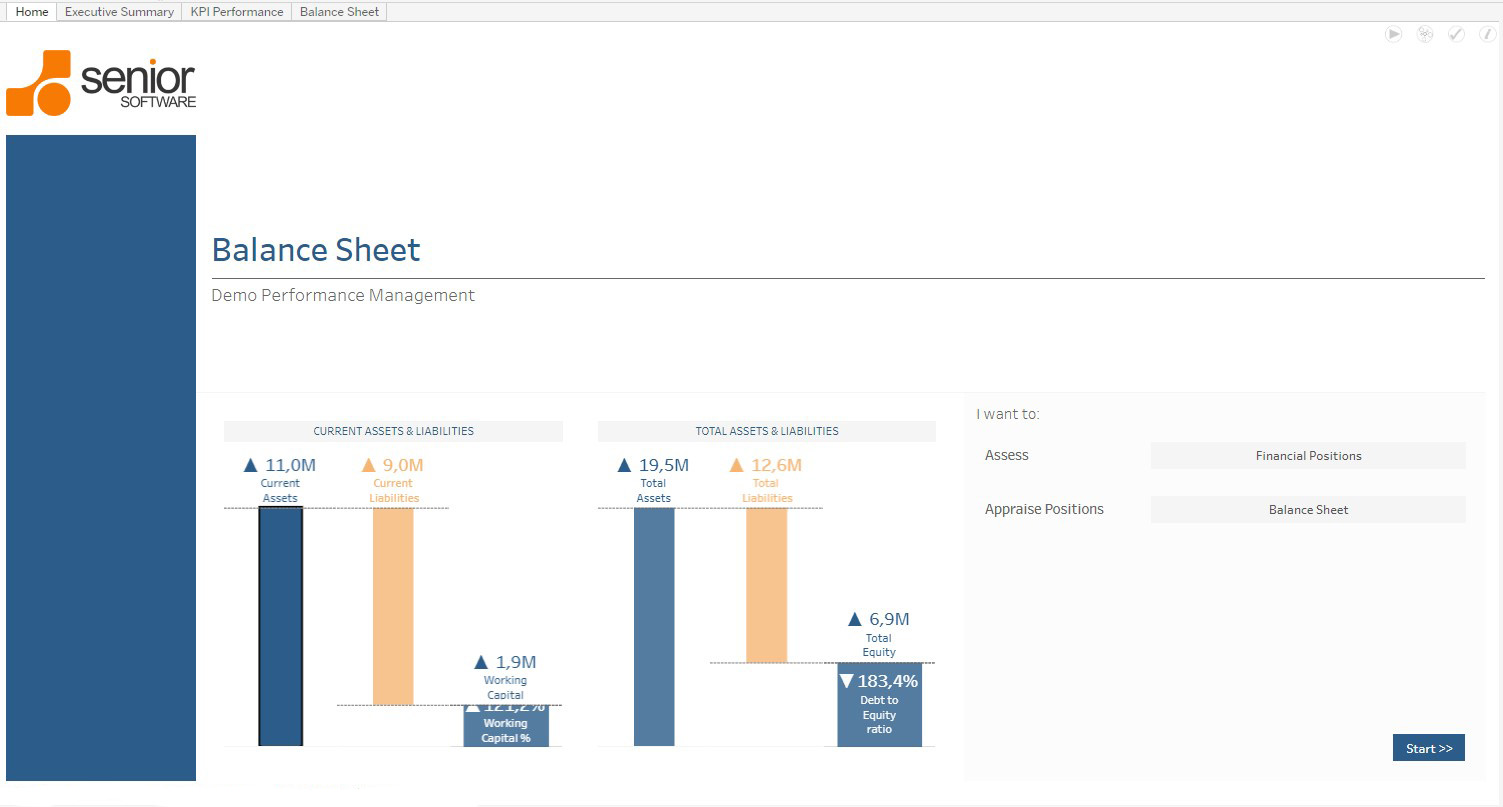
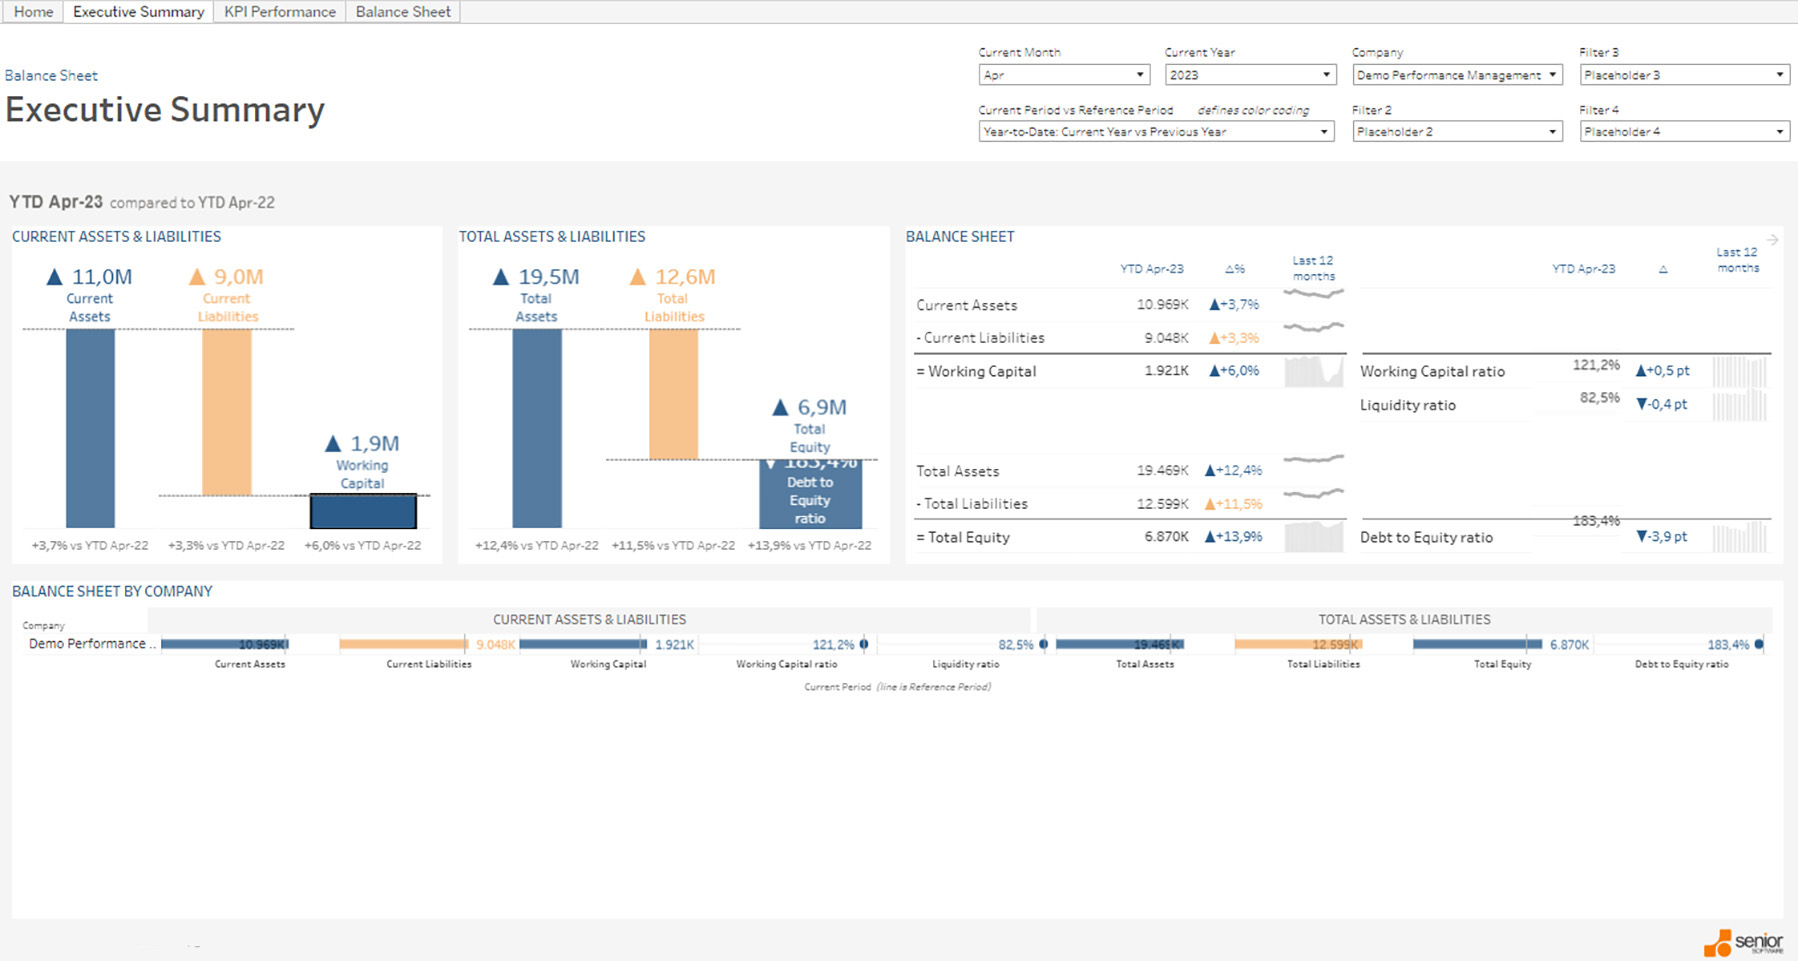
Correctly evaluate the company’s financial position

By analyzing the balance sheet and budget, companies can gain a better understanding of the company’s financial health and make informed decisions about the allocation of funds. This type of reporting helps you evaluate the company’s financial position at a certain date (month) and with budget loading and analysis of Current Month Actual vs. Budget, respectively Year To Date Actual vs. Budget.

Balance Sheet + Budget senior dashboard 2023
senior spm balance sheet and budget dashboard 2023

Make correct financial decisions, based on real-time data

The monthly comparison of actual costs with the budgeted ones and with those of the previous year, can help companies to measure and improve their performance, as well as to make informed decisions, based on correct data. This analysis allows you to examine the differences between actual and planned or budgeted expenses, as well as the reasons behind these differences. Thus, by highlighting the deviations between the actual costs and the budgeted costs, you will be able to follow positive and negative trends for each work unit.

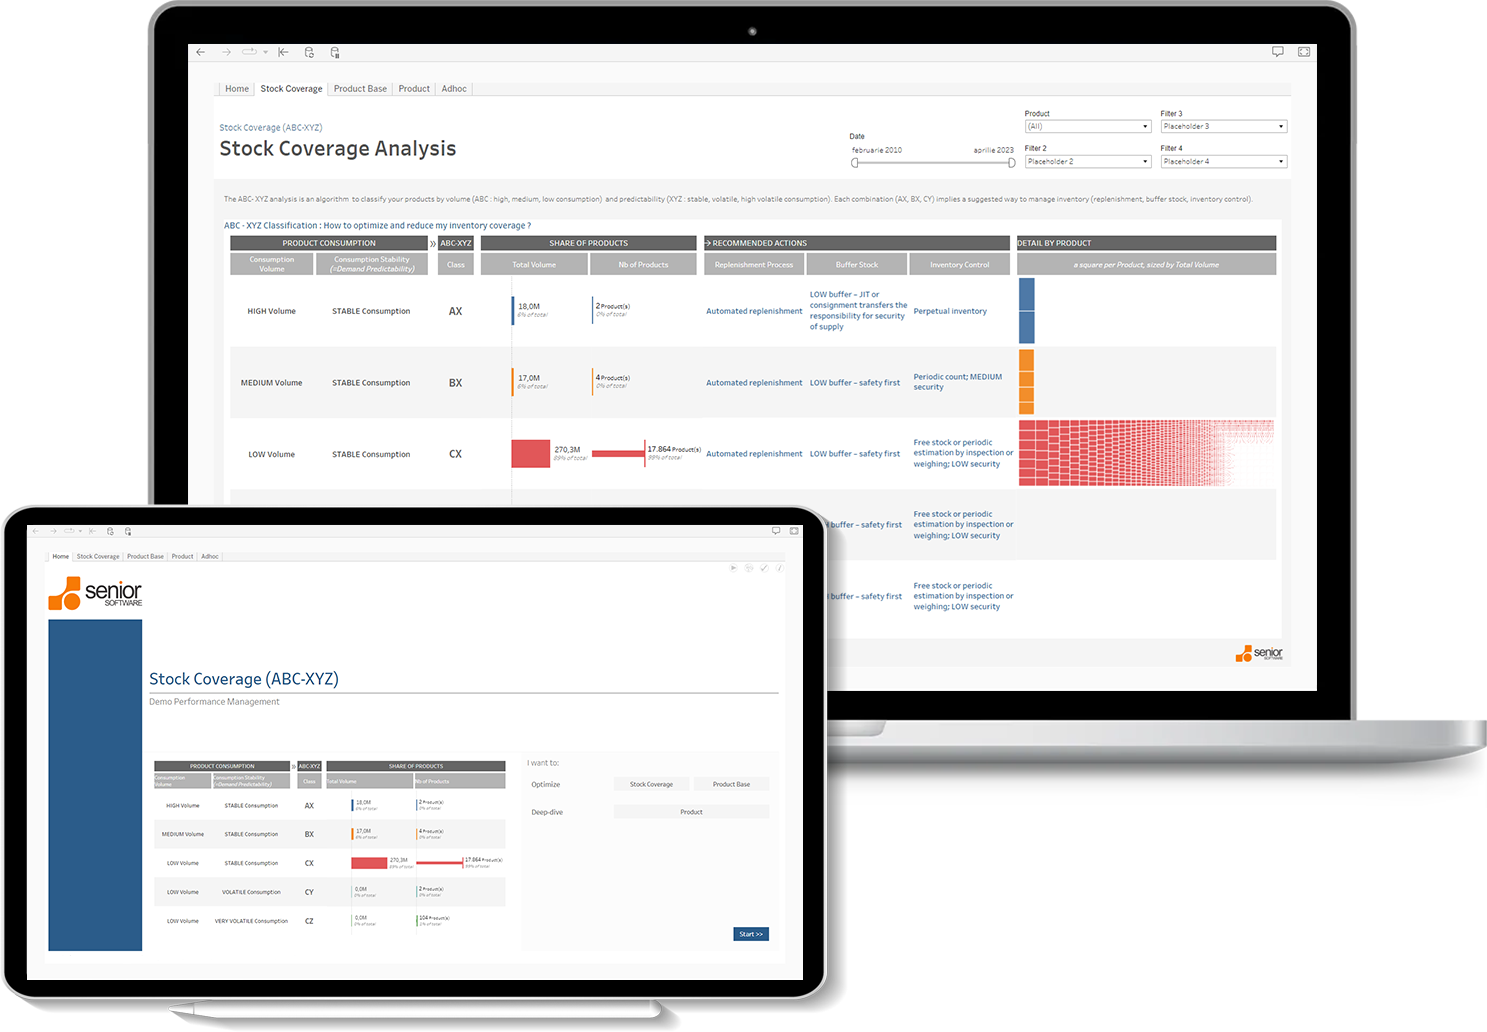
ABC/XYZ analysis: An essential tool for inventory planning

The optimization and ABC/XYZ inventory analysis dashboard provides organizations with a much more comprehensive view of their assets and customer needs. Among the benefits it offers companies are:

Evaluation and optimal distribution of goods in the warehouse, depending on their relevance and predictive analysis

Quick identification of priority products that generate maximum income and have a stable consumption

The efficiency of operations, as a result of the reorganization and optimization of the storage procedure

Improvement of inventory control, due to the placement of products according to the evolution of demand

Cost reduction, by avoiding excessive storage

Improve inventory levels

The inventory analysis dashboard allows for a much faster evaluation of the inventory situation and the real-time solution of eventualities, and among the benefits it offers to companies are:

Real-time access to information on stock status (out of stock, minimum stock, in stock, excess stock)

Easy planning of stock requirements and quick generation of orders for supply, transfer or production

Complete visibility on stock value (total value, excess stock, missing stock)

Quick monitoring of stocks depending on location

Optimizing stock levels

Monitor employee costs

The employee cost evaluation and monitoring dashboard contributes to increasing performance in the HR department, and among the benefits it offers companies are:

Easy monitoring of the achieved values vs. budgeted cost values

Complete visibility on all types of costs and the possibility to make correct decisions regarding their optimization

The ability to make quick decisions regarding the granting of increases and bonuses

More efficient organization of salary budgets

analiza ABC XYZ in soft pentru managementul performantei 2023

“Both the flexibility and the exact understanding of needs, together with the professionalism of the Senior Software team and its vast experience, were some of the elements that mattered a lot to us. The people are very well prepared and respond quickly whenever needed.

Laszlo Baruch, CEO – Ideal FoodPack

Senior Performance Management cu licentiere flexibila

The solution for analyzing key business indicators has a modular structure and can be delivered in different packages:

Silver Package

  • 1. Sales
  • 2. Profitability
  • 3. Spend Analytics
  • 4. Income Statement
  • 5. Balance Sheet
  • .
  • .
  • .
  • .

Gold Package

  • Everything available in the Silver pack +
  • 1. Financial Statement
  • 2. Purchasing
  • 3. Accounts Receivable
  • 4. Accounts Payable
  • 5. Price Realization
  • 6. Retail Sales
  • 7. RFM Analysis
  • .
Popular

Custom Package

  • Everything available in the Gold pack +
  • 1. Sales vs. Quota
  • 2. Profitability + Target
  • 3. Income Statement + Budget
  • 4. Balance Sheet + Budget
  • 5. Stock Coverage
  • 6. Budget Controlling
  • 7. HR Expenses
  • 8. Inventory

Discover the SPM system and the entire entire array of functionalities for performance management!

Find out more!

Discover all of Senior Software's solutions!